When there are many small jobs in the system we expect Predictor B to provide more accurate estimated queue times. Figure 5 shows a scatter plot of these predictions and the actual values.
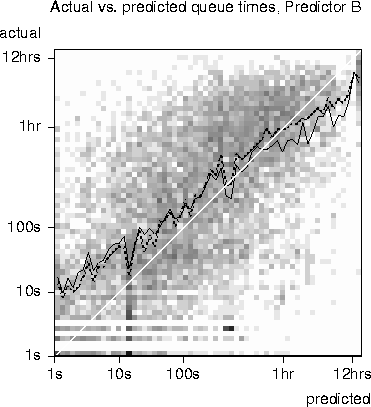
Figure 5: Scatterplot of actual queue times and predictions calculated by
Predictor B.
In general, the correlation here is about as good as for Predictor A (CC = 0.61). For short queue times, though, the predicted values tend to be too low. This reflects the optimism of the approximation: instead of having to wait for a job to complete and release all its processors, the approximation is based on the assumption that jobs are constantly giving up some of their processors. Thus, for small values of n' this predictor tends to guess too low.