Have the Nones Leveled Off?
Last month Ryan Burge published “The Nones Have Hit a Ceiling“, using data from the 2023 Cooperative Election Study to show that the increase in the number of Americans with no religious affiliation has hit a plateau. Comparing the number of Atheists, Agnostics, and “Nothing in Particular” between 2020 and 2023, he found that “the share of non-religious Americans has stopped rising in any meaningful way.”
When I read that, I was frustrated that the HERI Freshman Survey had not published new data since 2019. I’ve been following the rise of the “Nones” in that dataset since one of my first blog articles.
As you might guess, the Freshman Survey reports data from incoming college students. Of course, college students are not a representative sample of the U.S. population, and as rates of college attendance have increased, they represent a different slice of the population over time. Nevertheless, surveying young adults over a long interval provides an early view of trends in the general population.
Well, I have good news! I got a notification today that HERI has published data tables for the 2020 through 2023 surveys. They are in PDF, so I had to do some manual data entry, but I have results!
Religious preference
Among other questions, the Freshman Survey asks students to select their “current religious preference” from a list of seventeen common religions, “Other religion,” “Atheist”, “Agnostic”, or “None.”
The options “Atheist” and “Agnostic” were added in 2015. For consistency over time, I compare the “Nones” from previous years with the sum of “None”, “Atheist” and “Agnostic” since 2015.
The following figure shows the fraction of Nones from 1969, when the question was added, to 2023, the most recent data available.
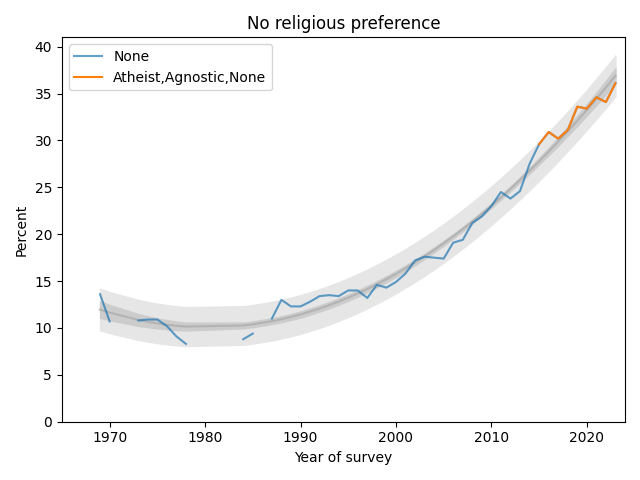
The blue line shows data until 2015; the orange line shows data from 2015 through 2019. The gray line shows a quadratic fit. The light gray region shows a 95% predictive interval.
The quadratic model continues to fit the data well and the recent trend is still increasing, but if you look at only the last few data points, there is some evidence that the rate of increase is slowing.
But not for women
Now here’s where things get interesting. Until recently, female students have been consistently more religious than male students. But that might be changing. The following figure shows the percentages of Nones for male and female students (with a missing point in 2018, when this breakdown was not available).
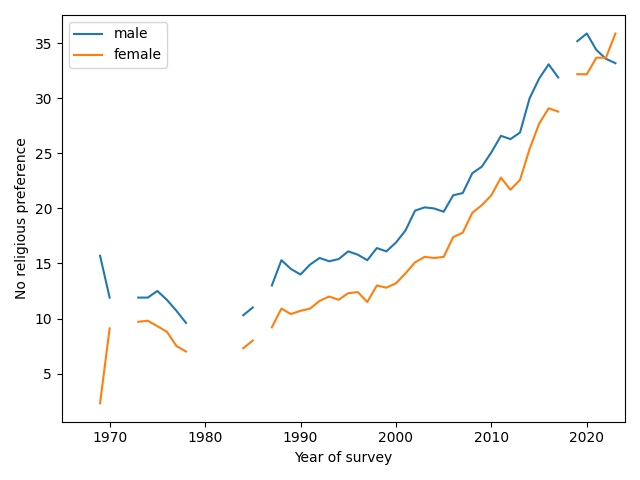
Since 2019, the percentage of Nones has increased for women and decreased for men, and it looks like women may now be less religious. So the apparent slowdown in the overall trend might be a mix of opposite trends in the two groups.
The following graph shows the gender gap over time, that is, the difference in percentages of male and female students with no religious affiliation.
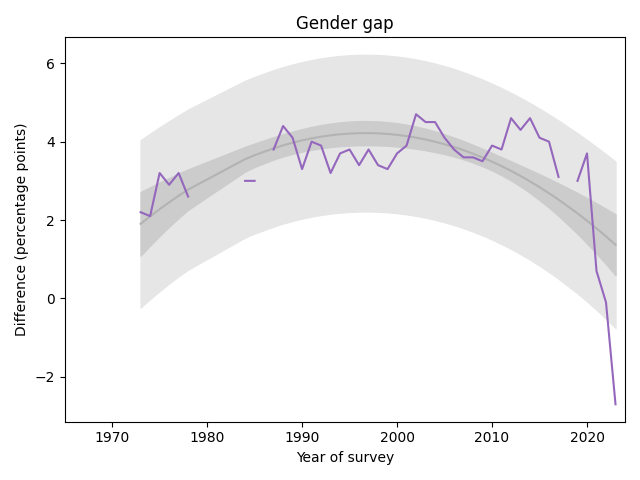
The gap was essentially unchanged from 1990 to 2020. But in the last three years it has changed drastically. It now falls outside the predictive range based on past data, which suggests a change this large would be unlikely by chance.
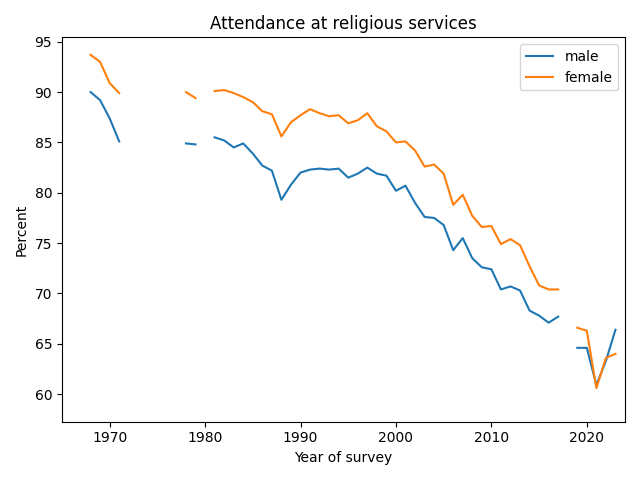
Similarly with attendance at religious services, the gender gap has closed and possibly reversed.
UPDATE: Ryan Burge looked at the gender gap in CES and GSS data and found similar results: especially among young people, the gender gap has either disappeared or crossed over. And Ryan pointed me to this article by Dan Cox and Kelsey Eyre Hammond which reports similar trends in data from the Survey Center on American Life.
Attendance
The survey also asks students how often they “attended a religious service” in the last year. The choices are “Frequently,” “Occasionally,” and “Not at all.” Respondents are instructed to select “Occasionally” if they attended one or more times, so a wedding or a funeral would do it.
The following figure shows the fraction of students who reported any religious attendance in the last year, starting in 1968. I discarded a data point from 1966 that seems unlikely to be correct.
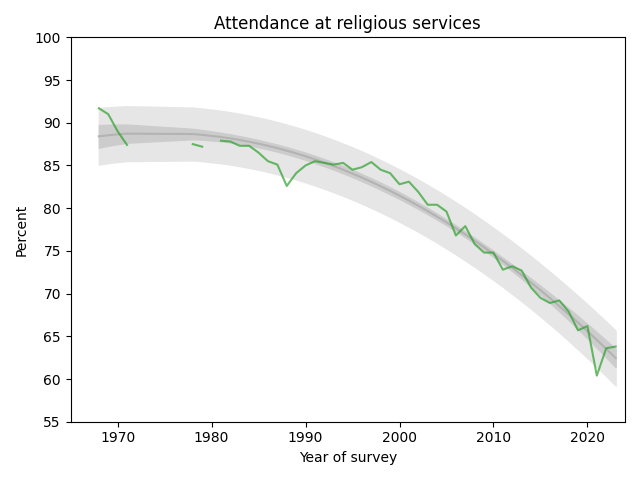
There is a clear dip in 2021, likely due to the pandemic, but the last two data points have returned to the long-term trend.
Data Source
The data reported here are available from the HERI publications page. Since I entered the data manually from PDF documents, it’s possible I have made errors.