Browsed by
Tag: correlation

Whatever the question was, correlation is not the answer

Whatever the question was, correlation is not the answer

Pearson’s coefficient of correlation, r, is one of the most widely-reported statistics. But in my opinion, it is useless; there is no good reason to report it, ever.

Most of the time, what you really care about is either effect size or predictive value:

  • To quantify effect size, report the slope of a regression line.

If there’s no reason to prefer one measure over another, report reduction in RMSE, because you can compute it directly from R².

If you don’t care about effect size or predictive value, and you just want to show that there’s a (linear) relationship between two variables, use R², which is more interpretable than r, and exaggerates the strength of the relationship less.

In summary, there is no case where r is the best statistic to report. Most of the time, it answers the wrong question and makes the relationship sound more important than it is.

To explain that second point, let me show an example.

Height and weight

I’ll use data from the BRFSS to quantify the relationship between weight and height. Here’s a scatter plot of the data and a regression line:

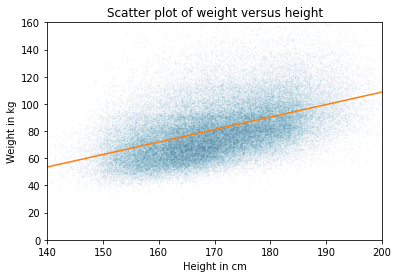
The slope of the regression line is 0.9 kg / cm, which means that if someone is 1 cm taller, we expect them to be 0.9 kg heavier. If we care about effect size, that’s what we should report.

If we care about predictive value, we should compare predictive error with and without the explanatory variable.

  • Without the model, the estimate that minimizes mean absolute error (MAE) is the median; in that case, the MAE is about 15.9 kg.
  • With the model, MAE is 13.8 kg.

So the model reduces MAE by about 13%.

If you don’t care about effect size or predictive value, you are probably up to no good. But even in that case, you should report R² = 0.22 rather than r = 0.47, because

  • R² can be interpreted as the fraction of variance explained by the model; I don’t love this interpretation because I think the use of “explained” is misleading, but it’s better than r, which has no natural interpretation.
  • R² is generally smaller than r, which means it exaggerates the strength of the relationship less.

[UPDATE: Katie Corker corrected my claim that r has no natural interpretation: it is the standardized slope. In this example, we expect someone who is one standard deviation taller than the mean to be 0.47 standard deviations heavier than the mean. Sebastian Raschka does a nice job explaining this here.]

In general…

This dataset is not unusual.  and r generally overstate the predictive value of the model.

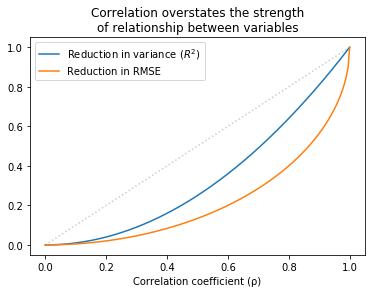
The following figure shows the relationship between r, , and the reduction in RMSE.

Values of r that sound impressive correspond to values of R² that are more modest and to reductions in RMSE which are substantially less impressive.

This inflation is particularly hazardous when r is small. For example, if you see r = 0.25, you might think you’ve found an important relationship. But that only “explains” 6% of the variance, and in terms of predictive value, only decreases RMSE by 3%.

In some contexts, that predictive value might be useful, but it is substantially more modest than r=0.25 might lead you to believe.

The details of this example are in this Jupyter notebook.

And the analysis I used to generate the last figure is in this notebook.

Correlation, determination, and prediction error

Correlation, determination, and prediction error

This tweet appeared in my feed recently:

I wrote about this topic in Elements of Data Science Notebook 9, where I suggest that using Pearson’s coefficient of correlation, usually denoted r, to summarize the relationship between two variables is problematic because:

  1. Correlation only quantifies the linear relationship between variables; if the relationship is non-linear, correlation tends to underestimate it.
  2. Correlation does not quantify the “strength” of the relationship in terms of slope, which is often more important in practice.

For an explanation of either of those points, see the discussion in Notebook 9. But that tweet and the responses got me thinking, and now I think there are even more reasons correlation is not a great statistic:

  1. It is hard to interpret as a measure of predictive power.
  2. It makes the relationship between variables sound more impressive than it is.

As an example, I’ll quantify the relationship between SAT scores and IQ tests. I know this is a contentious topic; people have strong feelings about the SAT, IQ, and the consequences of using standardized tests for college admissions.

I chose this example because it is a topic people care about, and I think the analysis I present can contribute to the discussion.

But a similar analysis applies in any domain where we use a correlation to quantify the strength of a relationship between two variables.

SAT scores and IQ

According to Frey and Detterman, “Scholastic Assessment or g? The relationship between the Scholastic Assessment Test and general cognitive ability“, the correlation between SAT scores and general intelligence (g) is 0.82.

That’s just one study, and if you read the paper, you might have questions about the methodology. But for now I will take this estimate at face value. If you find another source that reports a different correlation, feel free to plug in another value and run my analysis again.

In the notebook, I generate fake datasets with the same mean and standard deviation as the SAT and the IQ, and with a correlation of 0.82.

Then I use them to compute

  • The coefficient of determination, R²,
  • The mean absolute error (MAE),
  • Root mean squared error (RMSE), and
  • Mean absolute percentage error (MAPE).

In the SAT-IQ example, the correlation is 0.82, which is a strong correlation, but I think it sounds stronger than it is.

R² is 0.66, which means we can reduce variance by 66%. But that also makes the relationship sound stronger than it is.

Using SAT scores to predict IQ, we can reduce MAE by 44%, we can reduce RMSE by 42%, and we can reduce MAPE also by 42%.

Admittedly, these are substantial reductions. If you have to guess someone’s IQ (for some reason) your guesses will be more accurate if you know their SAT scores.

But any of these reductions in error is substantially more modest than the correlation might lead you to believe.

The same pattern holds over the range of possible correlations. The following figure shows R² and the fractional improvement in RMSE as a function of correlation:

For all values except 0 and 1, R² is less than correlation and the reduction in RMSE is even less than that.

Summary

Correlation is a problematic statistic because it sounds more impressive than it is.

Coefficient of determination, R², is a little better because it has a more natural interpretation: percentage reduction in variance. But reducing variance it usually not what we care about.

A better option is to choose a measure of error that is meaningful in context, possibly MAE, RMSE, or MAPE.

Which one of these is most meaningful depends on the cost function. Does the cost of being wrong depend on the absolute error, squared error, or percentage error? If so, that should guide your choice.

One advantage of RMSE is that we don’t need the data to compute it; we only need the variance of the dependent variable and either r or R². So if you read a paper that reports r, you can compute the corresponding reduction in RMSE.

But any measure of predictive error is more meaningful than reporting correlation or R².

The details of my analysis are in this Jupyter notebook.