Are we really polarized?
I’m working on a book called Probably Overthinking It that is about using evidence and reason to answer questions and guide decision making. If you would like to get an occasional update about the book, please join my mailing list.
I’m a little tired of hearing about how polarized we are, partly because I suspect it’s not true and mostly because it is “not even wrong” — that is, not formulated as a meaningful hypothesis.
To make it meaningful, we can start by distinguishing “mass polarization“, which is movement of popular attitudes toward the extremes, from polarization at the level of political parties. I’ll address mass polarization in this article and the other kind in the next.
The distribution of attitudes
To see whether popular opinion is moving toward the extremes, I’ll use data from the General Social Survey (GSS). And I’ll build on the methodology I presented in this previous article, where I identified fifteen questions that most strongly distinguish conservatives and liberals.
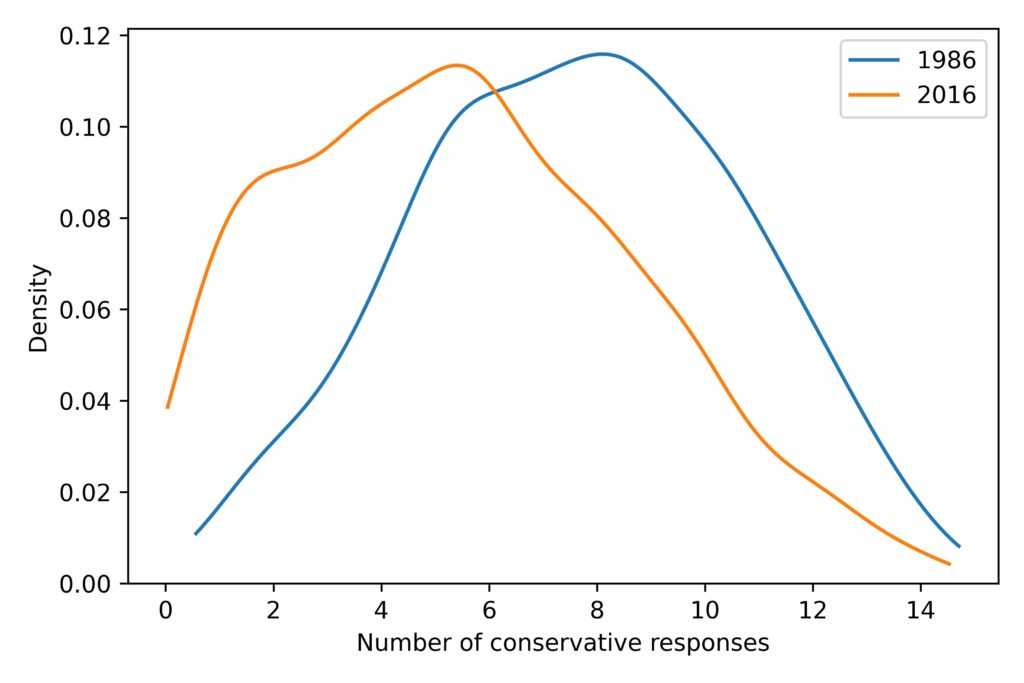
Not all respondents were asked all fifteen questions, but with some help from item response theory, I estimated the number of conservative responses each respondent would give, if they had been asked. From that, we can estimate the distribution of responses during each year of the survey. For example, here’s a comparison of distributions from 1986 and 2016:

First, notice that the distributions have one big mode near the middle, not two modes at the extremes. That means that most people choose a mixture of liberal and conservative responses to the questions; the people at the extremes are a small minority.
Second, the distribution shifted to the left during this period. In 1986, the average number of conservative responses was 7.6; in 2016, it was 5.5.
Now, let’s see what happened during the other years.
It’s just a jump to the left
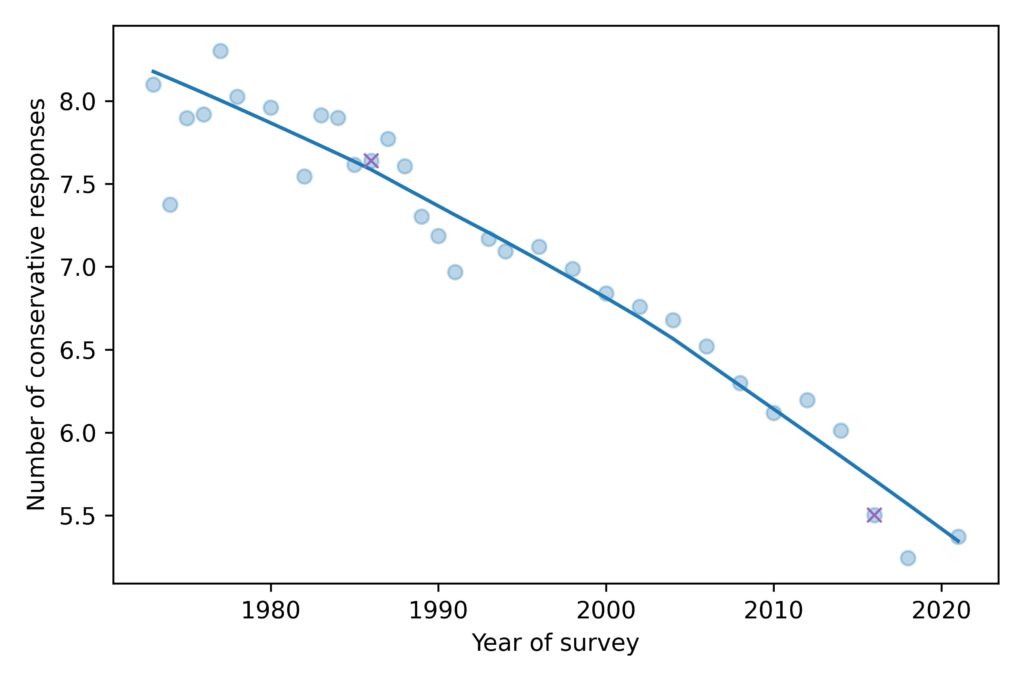
To summarize how the distribution of responses has changed over time, we’ll look at the mean, standard deviation, and mean absolute difference. Here’s the mean for each year of the survey:

The average level of conservatism, as measured by the fifteen questions, has been declining consistently for the duration of the GSS, almost 50 years.
The ‘x’ markers highlight 1986 and 2016, the years I chose in the previous figure. So we can see that these years are not anomalies; they are both close to the long-term trend.
Measuring polarization
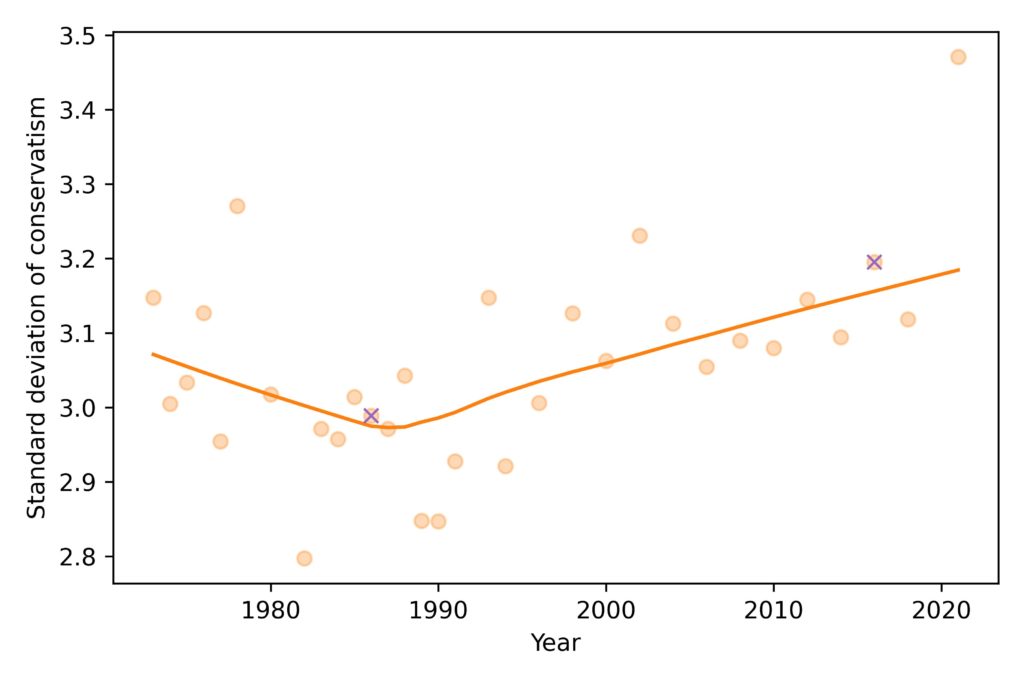
Now, to see if we are getting more polarized, let’s look at the standard deviation of the distribution over time:

The spread of the distribution was decreasing until the 1980s and has been increasing ever since. The value for 2021 is substantially above the long term trend, but it’s too early to say whether that’s a real change in polarization or an artifact of pandemic-related changes in data collection.
Again, the ‘x’ markers highlight the years I chose, and show why I chose them: they are close to the lowest and highest points in the long-term trend.
So there is some evidence of popular polarization. In fact, using standard deviation to quantify polarization might underestimate the size of the change, because the tail of the most recent distribution is compressed at the left end of the scale.
However, it is hard to interpret a change in standard deviation in practical terms. It was 3.0 in 1986 and 3.2 in 2016; is that a big change? I don’t know.
Don’t get MAD, get mean average difference
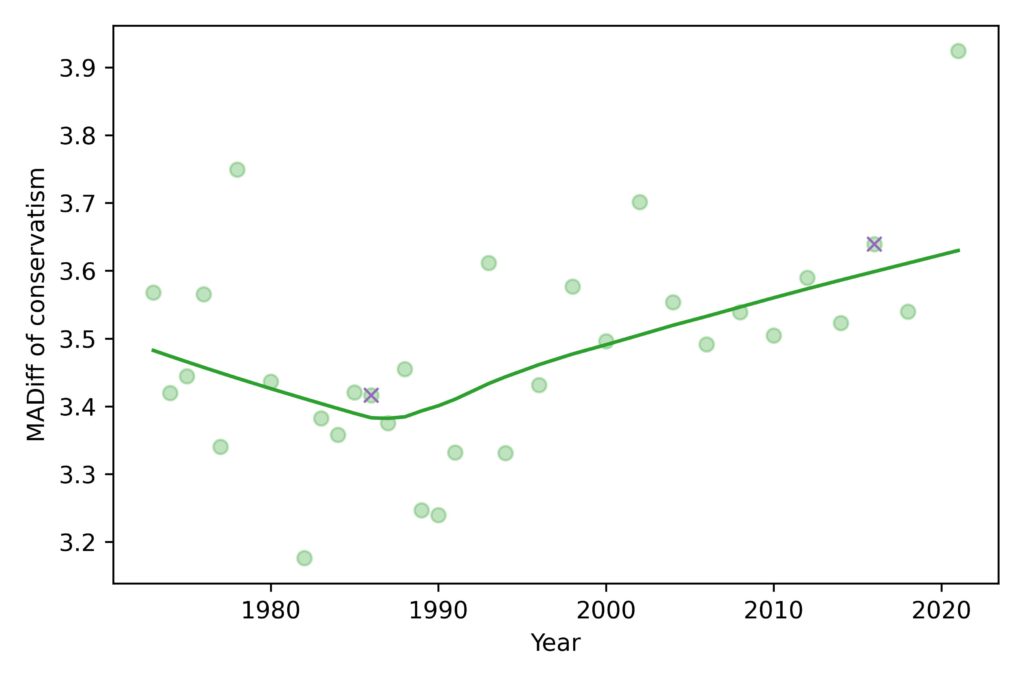
We can mitigate the effect of compression and help with interpretation by switching to a different measure of spread, mean absolute difference, which is the average size of the differences between pairs of people. Here’s how this measure has changed over time:

The mean absolute difference (MADiff) follows the same trend as standard deviation. It decreased until the 1980s and has increased ever since. It was 3.4 in 1986, which means that if you chose two people at random and asked them the fifteen questions, they would differ on 3.4 questions, on average. If you repeated the experiment in 2016, they would differ by 3.6.
This measure of polarization suggests that the increase since the 1980s has not been big enough to make much of a difference. If civilized society can survive when people disagree on 3.4 questions, it’s hard to imagine that the walls will come tumbling down when they disagree on 3.6.
In conclusion, it doesn’t look like mass polarization has changed much in the last 50 years, and certainly not enough to justify the amount of coverage it gets.
But there is another kind of polarization, at the level of political parties, that might be a bigger problem. I’ll get to that in the next article.