The Plurality of the Nones
Some time in the next 10-15 years, the most common religion in the United States will be “none”.

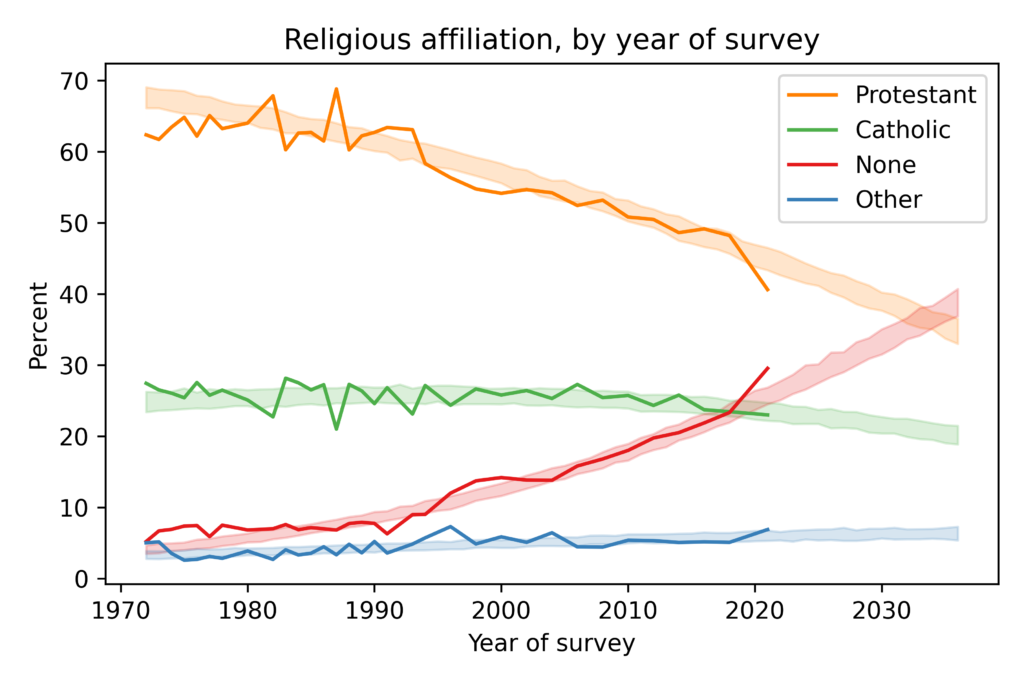
In this figure, the solid lines show estimated proportions of each religious affiliation from 1972 to 2021. Since the early 1990s, the proportion of Protestants has been declining and the proportion of people with no religious affiliation has been increasing. Catholicism has declined slightly and other religions have increased slightly.
Some of the data from 2021 is out of line with long-term trends. The pandemic affected data collection in several ways, so we should not make too much of these results for now.
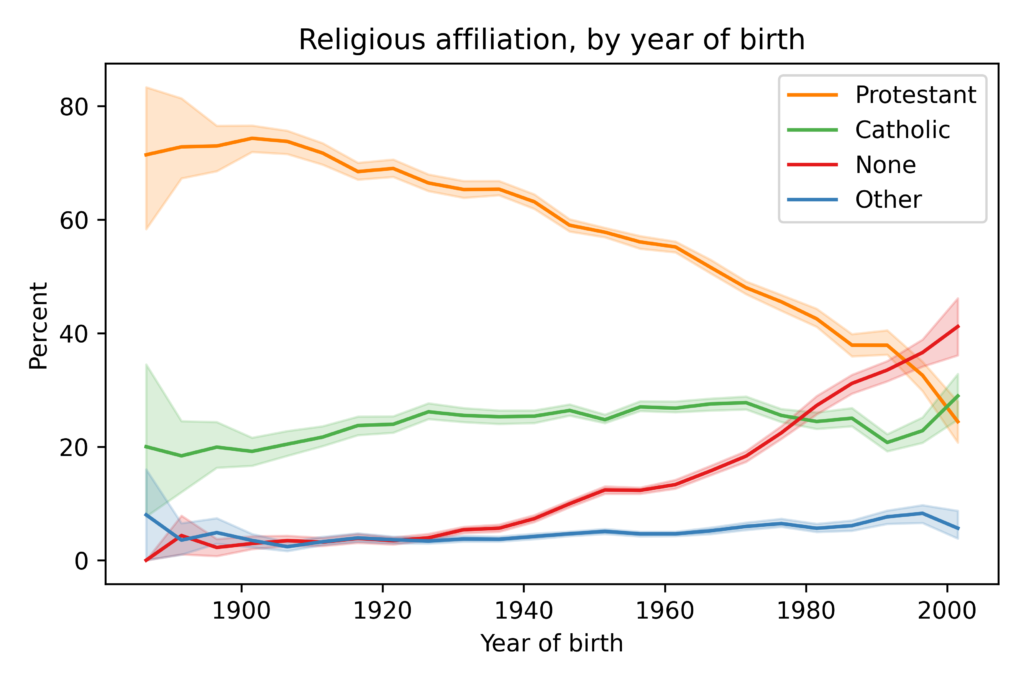
The shaded areas show results from a model I used to fit past data and forecast future changes. The model predicts that “Nones” will overtake Protestants in the 2030s. The primary cause of these changes is generational replacement: as older people die, they are replaced by young people who are less likely to be religious. The following figure shows the proportion of each religious tradition as a function of year of birth:

Among people born around 1900, nearly all were Protestant or Catholic; few belonged to another religion or none. Among people born around 2000, the plurality have no religious affiliation; Protestants and Catholics are statistically tied for second.
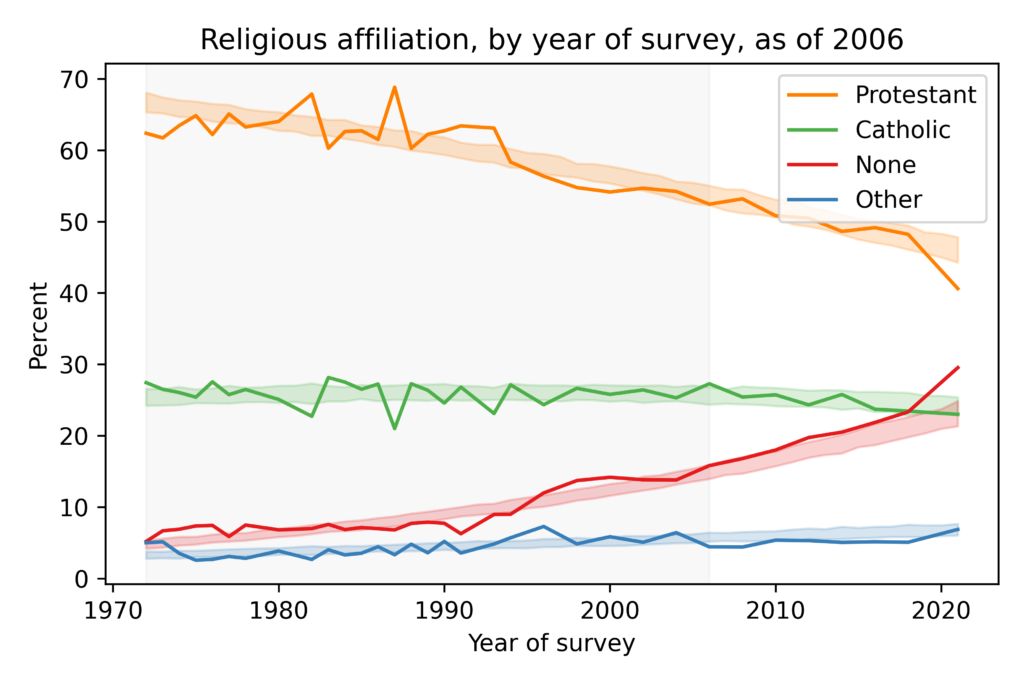
In general, forecasting social phenomena is hard because things change. However, generational replacement is relatively predictable. To see how predictable, let’s see what would have happened if we used the same method to generate predictions 15 years ago:

Predictions made in 2006 (using only the data in the shaded area) would have been pretty good. We would have underestimated the growth of the Nones, but the predictions for the other groups would have been accurate. So we have reason to think 15-year predictions based on current data are reliable.
If you want details, the model is multinomial logistic regression using two features: year of birth and year of survey. It is based on the assumption that (1) the distribution of ages will not change substantially over the next 15 years, and (2) most people don’t change religious affiliation as adults, or if they do, the resulting net flow between affiliations is small.