In Search Of: Simpson’s Paradox
Is Simpson’s Paradox just a mathematical curiosity, or does it happen in real life? And if it happens, what does it mean? To answer these questions, I’ve been searching for natural examples in data from the General Social Survey (GSS).
- A few weeks ago I posted this article, where I group GSS respondents by their decade of birth and plot changes in their opinions over time. Among questions related to faith in humanity, I found several instances of Simpson’s paradox; for example, in every generation, people have become more optimistic over time, but the overall average is going down over time. The reason for this apparent contradiction is generational replacement: as old optimists die, they are being replaced by young pessimists.
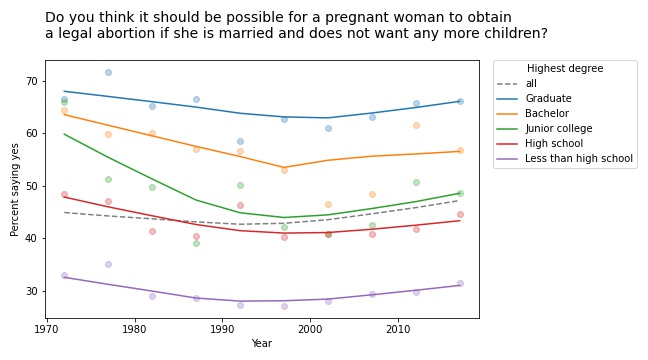
- In this followup article, I group people by level of education and plot their opinions over time, and again I found several instances of Simpson’s paradox. For example, at every level of education, support for legal abortion has gone down over time (at least under some conditions). But the overall level of support has increased, because over the same period, more people have achieved higher levels of education.
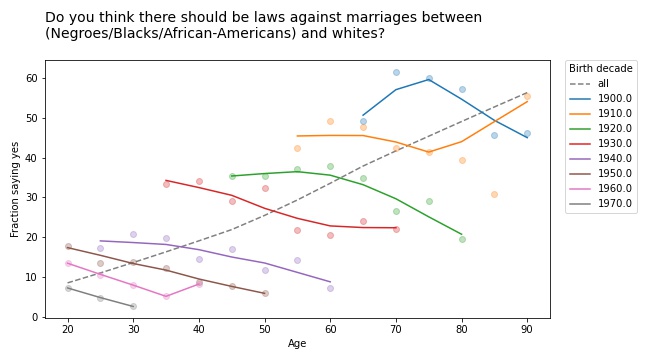
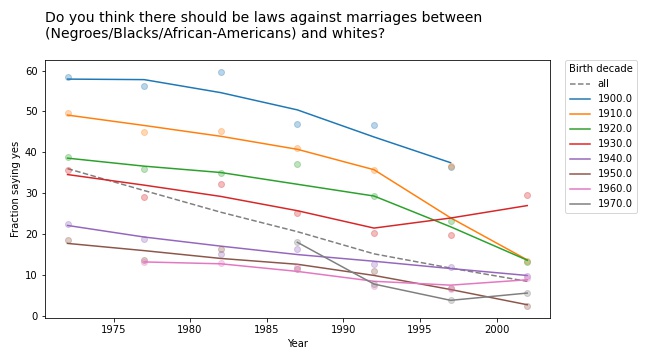
- In the most recent article, I group people by decade of birth again, and plot their opinions as a function of age rather than time. I found some of the clearest instances of Simpson’s paradox so far. For example, if we plot support for interracial marriage as a function of age, the trend is downward; older people are less likely to approve. But within every birth cohort, support for interracial marriage increases as a function of age.
With so many examples, we are starting to see a pattern:
- Examples of Simpson’s paradox are confusing at first because they violate our expectation that if a trend goes in the same direction in every group, it must go in the same direction when we put the groups together.
- But now we realize that this expectation is naive: mathematically, it does not have to be true, and in practice, there are several reasons it can happen, including generational replacement and period effects.
- Once explained, the examples we’ve seen so far have turned out not to be very informative. Rather than revealing useful information about the world, it seems like Simpson’s paradox is most often a sign that we are not looking at the data in the most effective way,
But before I give up, I want to give it one more try.
A more systematic search
Each example of Simpson’s paradox involves three variables:
- On the x-axis, I’ve put time, age, and a few other continuous variables.
- On the y-axis, I’ve put the fraction of people giving the most common response to questions about opinions, attitudes, and world view.
- And I have grouped respondents by decade of birth, age, sex, race, religion, and several other demographic variables.
At this point I have tried a few thousand combinations and found about ten clear-cut instances of Simpson’s paradox. So I’ve decided to make a more systematic search. From the GSS data I selected 119 opinion questions that were asked repeatedly over more than a decade, and 12 demographic questions I could sensibly use to group respondents.
With 119 possible variables on the x-axis, the same 119 possibilities on the y-axis, and 12 groupings, there are a 84,118 sensible combinations. When I tested them, 594 produced computational errors of some kind, in most cases because some variables have logical dependencies on others. Among the remaining combinations, I found 19 instances of Simpson’s paradox.
So one conclusion we can reach immediately is that Simpson’s paradox is rare in the wild, at least with data of this kind. But let’s look more closely at the 19 examples.
Many of them turn out to be statistical noise. For example, the following figure shows responses to a question about premarital sex on the y-axis, responses to a question about confidence in the press on the x-axis, with respondents grouped by political alignment.

As confidence in the press declines from left to right, the overall fraction of people who think premarital sex is “not wrong at all” declines slightly. But within each political group, there is a slight increase.
Although this example meets the requirements for Simpson’s paradox, it is unlikely to mean much. Most of these relationships are not statistically significant, which means that if the GSS had randomly sampled a different group of people, it is plausible that these trends might have gone the other way.
And this should not be surprising. If there is no relationship between two variables in reality, the actual trend is zero and the trend we see in a random sample is equally likely to be positive or negative. Under this assumption, we can estimate the probability of seeing a Simpson paradox by chance:
- If the overall trend is positive, the trend in all three groups has to be negative, which happens one time in eight.
- If the overall trend is negative, the trend in all three groups has to be positive, which also happens one time in eight.
When there are more groups, Simpson’s paradox is less likely to happen by chance. Even so, since we tried so many combinations, it is only surprising that we did find more.
A few good examples
Most of the examples I found are like the previous one. The relationships are so weak that the trends we see are mostly random, which means we don’t need a special explanation for Simpson’s paradox. But I found a few examples where the Simpsonian reversal is probably not random and, even better, it makes sense.
For example, the following figure shows the fraction of people who would support a gun law as a function of how often they pray, grouped by sex.

Within each group, the overall trend is downward: the more you pray, the less likely you are to favor gun control. But the overall trend goes the other way: people who pray more are more likely to support gun control. Before you proceed, see if you can figure out what’s going on.
At this point you might guess that there is a correlation of some kind between the variable on the x-axis and the groups. In this example, there is a substantial difference in how much men and women pray. The following figure shows how much:

And that’s why average support for gun control increases as a function of prayer:
- The low-prayer groups are mostly male, so average support for gun control is closer to the male response, which is lower.
- The high-prayer groups are mostly female, so the overall average is closer to the female response, which is higher.
On one hand, this result is satisfying because we were able to explain something surprising. But having made the effort, I’m not sure we have learned much. Let’s look at one more example.
The GSS includes the following question about a hypothetical open housing law:
Suppose there is a community-wide vote on the general housing issue. There are two possible laws to vote on. One law says that a homeowner can decide for himself whom to sell his house to, even if he prefers not to sell to [someone because of their race or color]. The second law says that a homeowner cannot refuse to sell to someone because of their race or color. Which law would you vote for?
The following figure shows the fraction of people who would vote for the second law, grouped by race and plotted as a function of income (on a log scale).

In every group, support for open housing increases as a function of income, but the overall trend goes the other way: people who make more money are less likely to support open housing.
At this point, you can probably figure out why:
- White respondents are less likely to support this law than Black respondents and people of other races, and
- People in the higher income groups are more likely to be white.
So the overall average in the lower income groups is closer to the non-white response; the overall average in the higher income groups is closer to the white response.
Summary
Is Simpson’s paradox a mathematical curiosity, or does it happen in real life?
Based on my exploration (and a similar search in a different dataset), if you go looking for Simpson’s paradox in real data, you will find it. But it is rare: I tried almost 100,000 combinations, and found only about 100 examples. And a large majority of the examples I found were just statistical noise.
What does Simpson’s paradox tell us about the data, and about the world?
In the examples I found, Simpson’s paradox doesn’t reveal anything about the world that is useful to know. Mostly it creates confusion, especially for people who have not encountered it before. Sometimes it is satisfying to figure out what’s going on, but if you create confusion and then resolve it, I am not sure you have made net progress. If Simpson’s paradox is useful, it is as a warning that the question you are asking and the way you are looking at the data don’t quite go together.
To paraphrase Henny Youngman,
The patient says, “Doctor, it’s confusing when I look at the data like this.”
The doctor says, “Then don’t do that!”
