Correlation, determination, and prediction error
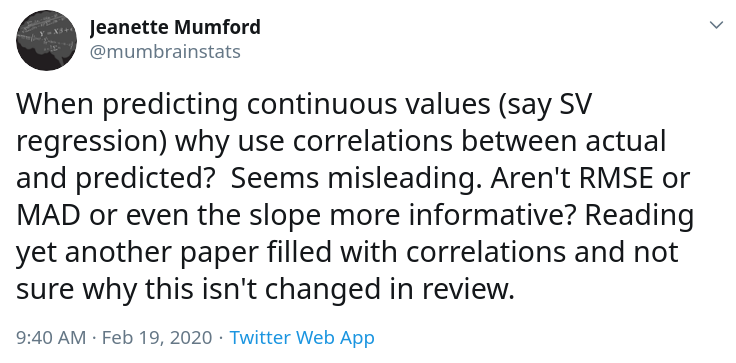
This tweet appeared in my feed recently:

I wrote about this topic in Elements of Data Science Notebook 9, where I suggest that using Pearson’s coefficient of correlation, usually denoted r, to summarize the relationship between two variables is problematic because:
- Correlation only quantifies the linear relationship between variables; if the relationship is non-linear, correlation tends to underestimate it.
- Correlation does not quantify the “strength” of the relationship in terms of slope, which is often more important in practice.
For an explanation of either of those points, see the discussion in Notebook 9. But that tweet and the responses got me thinking, and now I think there are even more reasons correlation is not a great statistic:
- It is hard to interpret as a measure of predictive power.
- It makes the relationship between variables sound more impressive than it is.
As an example, I’ll quantify the relationship between SAT scores and IQ tests. I know this is a contentious topic; people have strong feelings about the SAT, IQ, and the consequences of using standardized tests for college admissions.
I chose this example because it is a topic people care about, and I think the analysis I present can contribute to the discussion.
But a similar analysis applies in any domain where we use a correlation to quantify the strength of a relationship between two variables.
SAT scores and IQ
According to Frey and Detterman, “Scholastic Assessment or g? The relationship between the Scholastic Assessment Test and general cognitive ability“, the correlation between SAT scores and general intelligence (g) is 0.82.
That’s just one study, and if you read the paper, you might have questions about the methodology. But for now I will take this estimate at face value. If you find another source that reports a different correlation, feel free to plug in another value and run my analysis again.
In the notebook, I generate fake datasets with the same mean and standard deviation as the SAT and the IQ, and with a correlation of 0.82.
Then I use them to compute
- The coefficient of determination, R²,
- The mean absolute error (MAE),
- Root mean squared error (RMSE), and
- Mean absolute percentage error (MAPE).
In the SAT-IQ example, the correlation is 0.82, which is a strong correlation, but I think it sounds stronger than it is.
R² is 0.66, which means we can reduce variance by 66%. But that also makes the relationship sound stronger than it is.
Using SAT scores to predict IQ, we can reduce MAE by 44%, we can reduce RMSE by 42%, and we can reduce MAPE also by 42%.
Admittedly, these are substantial reductions. If you have to guess someone’s IQ (for some reason) your guesses will be more accurate if you know their SAT scores.
But any of these reductions in error is substantially more modest than the correlation might lead you to believe.
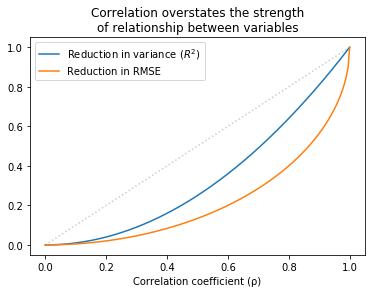
The same pattern holds over the range of possible correlations. The following figure shows R² and the fractional improvement in RMSE as a function of correlation:

For all values except 0 and 1, R² is less than correlation and the reduction in RMSE is even less than that.
Summary
Correlation is a problematic statistic because it sounds more impressive than it is.
Coefficient of determination, R², is a little better because it has a more natural interpretation: percentage reduction in variance. But reducing variance it usually not what we care about.
A better option is to choose a measure of error that is meaningful in context, possibly MAE, RMSE, or MAPE.
Which one of these is most meaningful depends on the cost function. Does the cost of being wrong depend on the absolute error, squared error, or percentage error? If so, that should guide your choice.
One advantage of RMSE is that we don’t need the data to compute it; we only need the variance of the dependent variable and either r or R². So if you read a paper that reports r, you can compute the corresponding reduction in RMSE.
But any measure of predictive error is more meaningful than reporting correlation or R².