All of my books were written in LaTeX. For a long time I used emacs to compose, pdflatex to convert to PDF, Hevea to convert to HTML, and a hacked-up version of plasTeX to convert to DocBook, which is one of the formats I can submit to my publisher, O’Reilly Media.
Recently I switched from emacs to Texmaker for composition, and I recommend it strongly. I also use Overleaf for shared LaTeX documents, and I can recommend that, too.
However, the rest of the tools I use are pretty clunky. The HTML I get from Hevea is not great, and my hacked version of plasTeX is just awful (which is not plasTeX’s fault).
Since I am starting some new book projects, I decided to rethink my tools. So I asked Twitter, “If you were starting a new book project today, what typesetting language / development environment would you use? LaTeX with Texmaker? Bookdown with RStudio? Jupyter?Other?”
I got some great responses. You can read the whole thread yourself, but I will try to summarize it here.
LaTeX
 Nelis Willers “wrote a 510 page book with LaTeX, using WinEdt and MiKTeX and CorelDraw for diagrams. Worked really well.”
Matt Boelkins likes “PreTeXt, hands down: It has LaTeX and HTML as potential outputs among many. See the gallery of existing texts on the linked page.”
makusu recommends “Emacs org-mode. Easy to just write your content, seamless integration with latex, easy output to latex, PDF, markdown and HTML.”
AsciiDoc
Luciano Ramalho recommends “AsciiDoc, for sure. That’s how I wrote @fluentpython. It’s syntax more user-friendly than ReStructuredText and way more expressive than Markdown. AsciiDoc was *designed for* book publishing. It’s as expressive as DocBook, but it ain’t XML. With @asciidoctor you can render locally.”
JD Long provides a useful reminder: “It’s dependent on the publisher as well as the content of the book. I like Bookdown for R, but if I were doing a devops book for O’Reilly I’d write directly in AsciiDoc, for example. So I think context matters highly.”
Yves Hilpisch says “AsciiDoctor is my favorite these days. Clear syntax, nice output, fast rendering (HTML/PDF). Have custom Python scripts that convert @ProjectJupyter notebooks into text files from which I include code snippets automatically.” His scripts are in this GitHub repository.
Markdown
Robert Talbot recommends “Markdown in a plain text editor, with Pandoc on the back end for the finished product. This is assuming that the book is mostly text. If it involves code, I might lean more toward Jupyter and some kind of Binder based process.” Here’s a blog post Robert wrote on the topic.
I got a recommendation for this blog post by Thorsten Ball, who uses Markdown, pandoc, and KindleGen.
One person recommended “writing Markdown then using pandoc to pass to LaTeX”, which is an interesting chain.
Visual Studio Code got a few mentions: “I haven’t written a full book using it, but VS Code plus markdown preview and other editing plugins is my current go-to for small articles”
“Bookdown in RStudio is wonderful to use.”
Jupyter
Chris Holdgraf is “working on a project to help people make nicely rendered online books from collections of Jupyter notebooks. We use it @ Berkeley for teaching at http://inferentialthinking.com.”
RestructuredText
Jason Moore recommends “your preferred text editor + RestructuredText + Sphinx = pdf/epub/html output; wrote my dissertation with it 6 years ago and was quite happy with the results.”
Matt Harrison uses his “own tools around rst (with conversion to LaTeX and epub).”
Other
Pollen: the book is a program
Raffaele Abate recommends “ScrivenerApp: I’ve used their Linux beta in past for a short, nonscientific, book and I can say it’s an amazing software for this purpose. I’ve read that is usable also for scientific publishing with profit.”
Lak Lakshmanan wrote, “I used Google docs for my previous book and for my current offer. Not as composable as latex, but amazing for collaboration. Books need to fine-grained reviews and edits by several people spread around the world. Nothing like Google docs for that.”
And the winner is…
For now I am working in LaTeX with Texmaker, but I have run it through pandoc to generate AsciiDoc, and that seems to work well. I will work on the book and the conversion process at the same time. At some point, I might switch over to editing in AsciiDoctor. I also need to do a test run with O’Reilly to see if they can ingest the AsciiDoc I generate.
I will post updates as I work out the details.
Thank you to everyone who responded!
 Nelis Willers “wrote a 510 page book with LaTeX, using
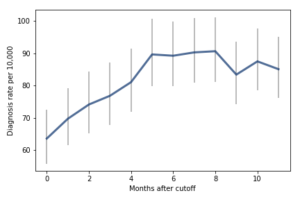 For the first 9 months, from September to May, we see what we would expect if at least some of the excess diagnoses are due to age-related behavior differences. For each month of difference in age, we see an increase in the number of diagnoses.
This pattern breaks down for the last three months, June, July, and August. This might be explained by random variation, but it also might be due to parental intervention; if some parents hold back students born near the deadline, the observations for these months include some children who are relatively old for their grade and therefore less likely to be diagnosed.
We could test this hypothesis by checking the actual ages of these students when they started school, rather than just looking at their months of birth. I will see whether that additional data is available; in the meantime, I will proceed taking the data at face value.
I fit the data using a Bayesian logistic regression model, assuming a linear relationship between month of birth and the log-odds of diagnosis. The following figure shows the fitted models superimposed on the data.
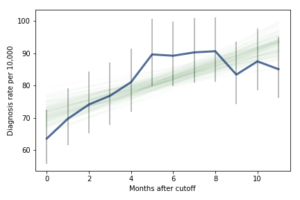 Most of these regression lines fall within the credible intervals of the observed rates, so in that sense this model is not ruled out by the data. But it is clear that the lower rates in the last 3 months bring down the estimated slope, so we should probably consider the estimated effect size to be a lower bound on the true effect size.
To express this effect size in a way that’s easier to interpret, I used the posterior predictive distributions to estimate the difference in diagnosis rate for children born in September and August. The difference is 21 diagnoses per 10,000, with 95% credible interval (13, 30).
As a percentage of the baseline (71 diagnoses per 10,000), that’s an increase of 30%, with credible interval (18%, 42%).
However, if it turns out that the observed rates for June, July, and August are brought down by red-shirting, the effect could be substantially higher. Here’s what the model looks like if we exclude those months:
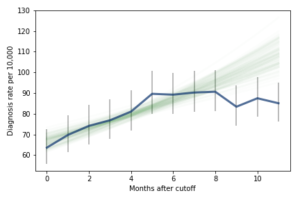 Of course, it is hazardous to exclude data points because they violate expectations, so this result should be treated with caution. But under this assumption, the difference in diagnosis rate would be 42 per 10,000. On a base rate of 67, that’s an increase of 62%.
Here is the notebook with the details of my analysis:
 Here’s another Bayes puzzle: